January 27 was one of the weakest day for the markets since December 23 with a sharp spike in volatility and a steep fall of around 1.5 percent despite positive global cues. Correction in banks and metal stocks pulled the market significantly down on Friday, the first day of February series.
The BSE Sensex plunged 874 points to 59,331, while the Nifty50 tanked 288 points to 17,604, the lowest closing level since October 21, forming a long bearish candle on the daily charts with lower-highs-lower-lows for the second consecutive session.
The broader markets also followed similar trend, as the Nifty Midcap 100 and Smallcap 100 indices lost 1.5 percent and 1.9 percent, respectively, on weak breadth. Nearly six shares declined for every rising share on the NSE.
Volatility climbed sharply, moving well above all important exponential moving averages of 50, 100 and 200 days, giving discomfort to bulls. India VIX, the fear index, jumped 18.18 percent to 17.32, from 14.66 level.
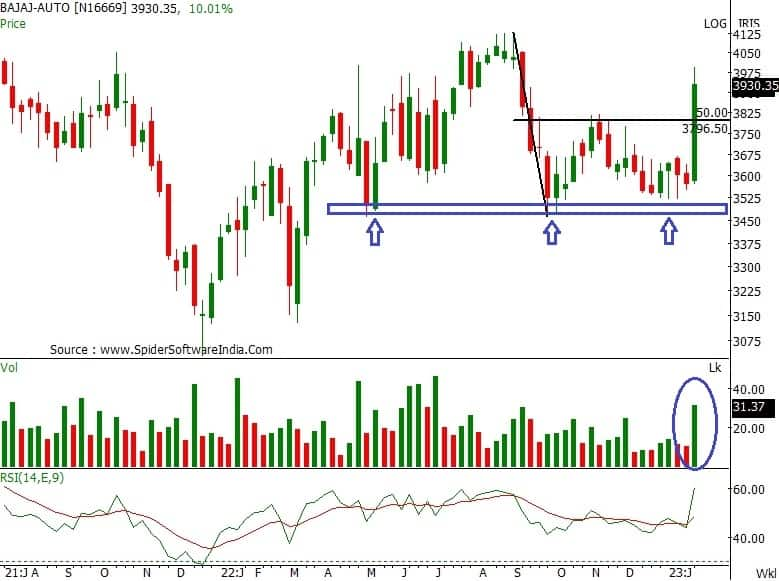
Stocks that were in action and bucked the trend included Bajaj Auto, which was the second biggest gainer in the Nifty50, rising nearly 6 percent to Rs 3,937, the biggest closing level since September 5. The stock has seen uptrend and bullish candle formation for fourth straight session, with significantly large volumes. In fact, it has been in an uptrend since the breakout of downward sloping resistance trend line adjoining September 1 last year and January 18, 2023.
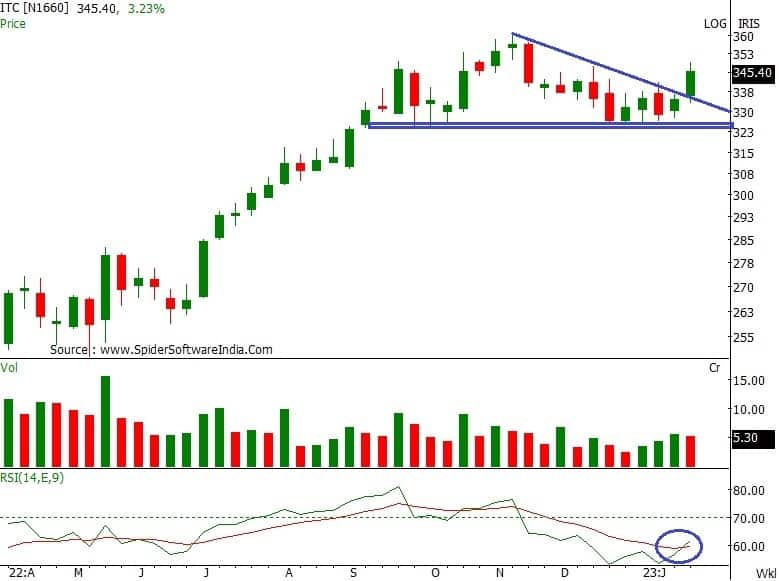
ITC was another large-cap stock that performed better, climbing 2 percent to Rs 346, the biggest closing level since November 14 last year and formed bullish candle on the daily charts with higher high formation for fourth straight session, with above average volumes for last several sessions. It has given a decent breakout of long downward sloping resistance trend line adjoining multiple touchpoints at higher levels (November 9, November 11 last year, and January 25).
Supreme Industries was also in focus, jumping more than 5 percent, the biggest single day gains since December 26, to close at Rs 2,539, the highest closing level since December 19. The stock has formed strong bullish candle on the daily charts with healthy volumes, with higher highs higher lows for third straight session. It has seen a breakout of downward sloping resistance trend line adjoining multiple touchpoints at higher levels (December 14, December 19, and January 25).
Here's what Rajesh Palviya of Axis Securities recommends investors should do with these stocks when the market resumes trading today:
Since April 2022, the stock was firmly consolidating around Rs 3,500 which remains a major support zone. With last week's strong upmove of 10 percent, the stock has recovered past three months' losses denoting fastest retracement and strong come back of bulls.
On the weekly chart, the stock has also confirmed trend reversal indicating positive bias ahead. This buying momentum was accompanied with huge volumes indicating increased participation.
The bullish gap area formed on January 27, 2023 within Rs 3,830-3,740 remains an immediate support zone. The stock is well placed above its 20, 50, 100 and 200-day SMA which reconfirms bullish trend. The daily and weekly "band Bollinger" buy signal signals increased momentum.
Investors should buy, hold and accumulate this stock with an expected upside of Rs 4,100-4,250, with downside support zone of Rs 3,830-3,800 levels.
The stock is in strong uptrend across all the time frames forming a series of higher tops and higher bottoms. With Friday's strong up move the stock has confirmed one month "down-sloping" trendline breakout at Rs 2,485 levels on a closing basis. This breakout is accompanied with huge volumes which signals increased participation in the rally.
The daily, weekly and monthly strength indicator RSI (relative strength index) is in positive terrain which indicates sustained strength.
Investors should buy, hold and accumulate this stock with an expected upside of Rs 2,620-2,700 levels with downside support zone of Rs 2,400-2,330 levels.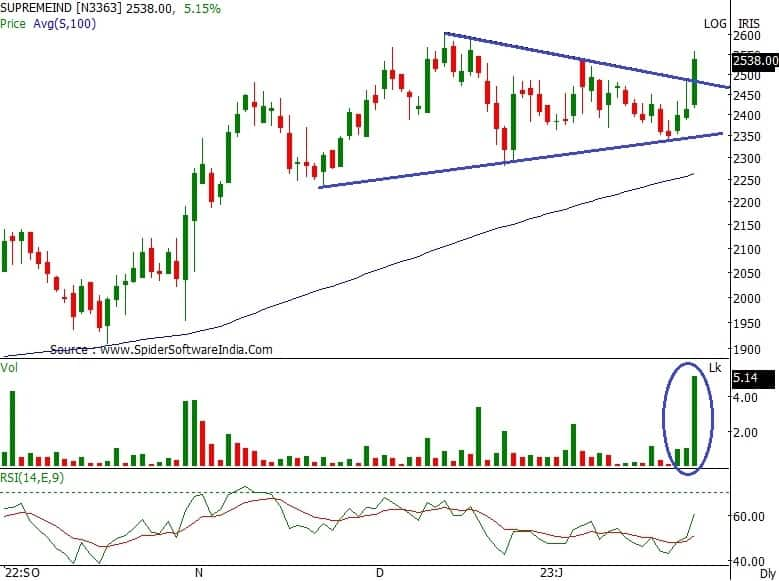
The stock is in strong uptrend across all the time frames forming a series of higher tops and bottoms. Since past 4-5 months the stock has managed to hold its major multiple support zone of Rs 330-325 levels.
With current week's 3 percent gains the stock has surpassed nine-week's multiple resistance zone of Rs 342 on closing basis which shows resumption of prior uptrend. The daily, weekly and monthly strength indicator RSI is in positive terrain which indicates sustained strength.
Investors should buy, hold and accumulate this stock with an expected upside of Rs 360-375 with downside support zone of Rs 330-325 levels.
Disclaimer: The views and investment tips expressed by investment experts on Moneycontrol.com are their own and not those of the website or its management. Moneycontrol.com advises users to check with certified experts before taking any investment decisions.